As part of our series on hands-on performance reviews for selected web hosts, we kick off with ScalaHosting. This article demonstrates the response of a website hosted on ScalaHosting’s Managed Cloud VPS under simulated conditions.
Test Objective
To simulate an increasing load on the hosting server and observe if performance is regular throughout the process.
Our Test Setup and Configuration
Note: Please refer to our Test Methodologies page for a detailed understanding of our setup, tools, and methodologies.
We keep most options at their default settings to maintain consistency across our tests. This generally means we are testing a barebones version of WordPress with standardized test parameters.
Hosting Plan: Managed Cloud Plan (Build #1)

Server Location: Texas, USA

Server Resources: 2 CPU (2.3Ghz), 2GB RAM

Web Server: LiteSpeed

PHP version: 8.3.4

Website CMS: WordPress (Version 6.4.3)

Load Testing Tool: Loadview Testing
Test Site
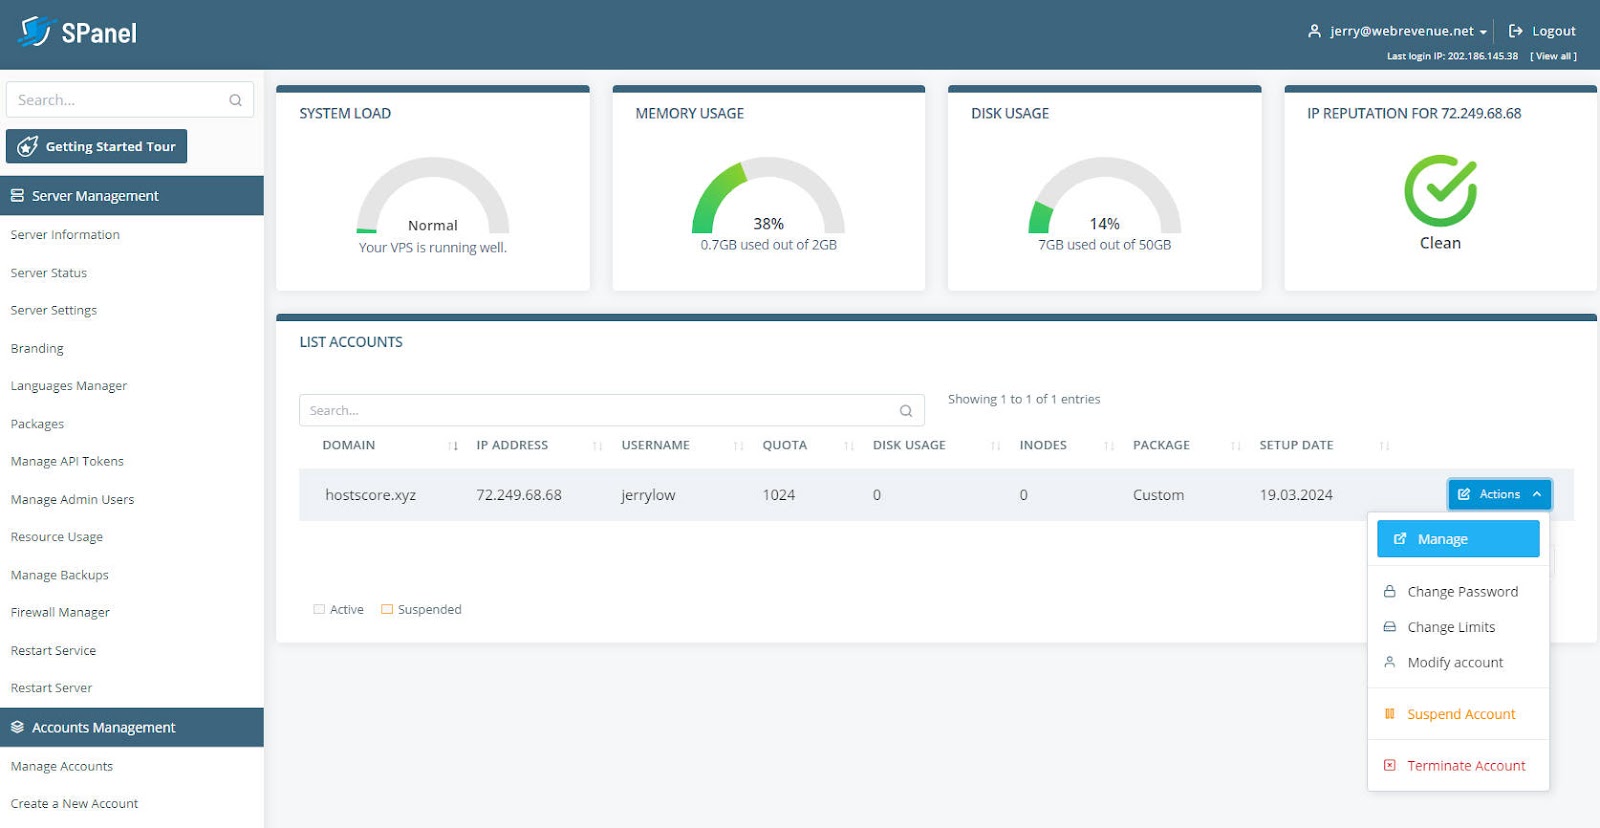
The WordPress installation at www.hostscore.xyz was done using SPanel – ScalaHosting’s proprietary web hosting management tool. Like cPanel, sPanel provides users an easy way to manage their hosting environment.
In this case, that meant a one-click installation of WordPress. No installation options were selected beyond the default. There was also no Content Distribution Network attached to the test site.
Load Testing Tool

Our next step was to create a simulated test using Dotcom-Monitor’s LoadView tester. LoadView can be configured in various ways to stimulate real life scenarios. This allows us to run tests under various conditions and observe results for performance fine-tuning.
Since most websites will cater to users in various geographic locations, performance testing is configured to load virtual users from specific zones. The zones defined are as follows:
US Test Locations
- US East, N Virginia
- US West, Oregon
- US West, N. California
- US East, Ohio
- Canada Central, Mont.
- South Central US, Tex
US + EU Test Locations
- US East, N Virginia
- US West, Oregon
- US West, N. California
- East US, Virginia
- EU, Spain
- EU, London
- EU, Stockholm
- Germany, Frankfurt
US + Asia Locations
- US East, N Virginia
- US West, Oregon
- US West, N. California
- East US, Virginia
- AP Mumbai
- AP Melbourne
- Japan East, Tokyo
- AP Singapore
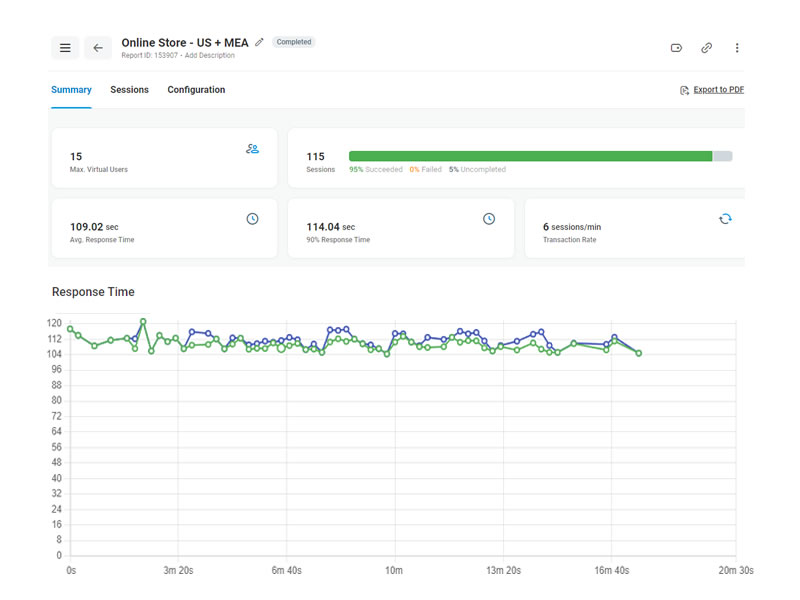
US + MEA Locations
- US East, N Virginia
- US West, Oregon
- US West, N. California
- East US, Virginia
- UAE North, Dubai
- ME, UAE
- ME, Bahrain
- Africa, Cape Town
Observations
Per our methodology, tests were conducted in three configurations from five regions.
During the tests, zero abnormalities were observed. No errors were occurring for any of the simulated actions.
There is no significant change in response speed when server is loaded.
Note that website owners should pay closer attention to the 90% response time since that is the experience that most users will face.
Test server shows consistent results when tested against loads from different regions. We believe primary reasons behind the delay in response times are due to latency.
Benchmark Results (ms)
Average Response Time (ms)
| Scenarios | Benchmark (No Load) | Benchmark (With Load) | Differences |
|---|---|---|---|
| One Page Visit | 1.30 | 1.30 | 0.00% |
| Forum | 34.21 | 33.91 | -0.88% |
| eCommerce Checkout | 110.28 | 108.42 | -1.69% |
90% Response Time (ms)
| Scenarios | Benchmark (No Load) | Benchmark (With Load) | Differences |
|---|---|---|---|
| One Page Visit | 2.09 | 2.09 | 0.00% |
| Forum | 37.82 | 36.94 | -2.33% |
| eCommerce Checkout | 113.33 | 110.23 | -2.74% |
Load Tests from Different Regions
Average Response Time (ms)
| Scenarios | Benchmark (With Load) | US | US & EU | US & Asia | US & MEA |
|---|---|---|---|---|---|
| One Page Visit | 1.30 | 1.74 | 1.9 | 2.09 | 2.12 |
| Forum | 33.91 | 33.89 | 34.41 | 34.6 | 35.18 |
| eCommerce Checkout | 108.42 | 108.77 | 109.67 | 108.95 | 109.02 |
90% Response Time (ms)
| Scenarios | Benchmark (With Load) | US | US & EU | US & Asia | US & MEA |
|---|---|---|---|---|---|
| One Page Visit | 2.09 | 3.11 | 2.98 | 3.6 | 3.75 |
| Forum | 36.94 | 37.43 | 37.62 | 37.81 | 39.22 |
| eCommerce Checkout | 110.23 | 111.64 | 114.67 | 113.2 | 114.04 |
Differences in Average Response Time vs Benchmark (%)
| Scenarios | US | US & EU | US & Asia | US & MEA |
|---|---|---|---|---|
| One Page Visit | 33.85% | 46.15% | 60.77% | 63.08% |
| Forum | -0.06% | 1.47% | 2.03% | 3.75% |
| eCommerce Checkout | 0.32% | 1.15% | 0.49% | 0.55% |
Differences in 90% Response Time vs Benchmark (%)
| Scenarios | US | US & EU | US & Asia | US & MEA |
|---|---|---|---|---|
| One Page Visit | 48.80% | 42.58% | 72.25% | 79.43% |
| Forum | 1.33% | 1.84% | 2.36% | 6.17% |
| eCommerce Checkout | 1.28% | 4.03% | 2.69% | 3.46% |
Reading the Table
- All numbers are in milliseconds (ms).
- US: United States, EU: Europe, MEA: Middle East and Africa
- In “Benchmark” scenario, loads are simulated from the load injector closest the ScalaHosting server location (Texas, US). No load was added during the process.
- In “US” scenario, loads are simulated from two load injectors each from East Coast, West Coast, and Central in the United States.
- In “US & EU” scenario, loads are simulated from 4 US locations (2 East + 2 West Coast) plus Spain, United Kingdom, Sweden, and Germany.
- In “US & Asia” scenario, loads are simulated from 4 US locations (2 East + 2 West Coast) plus Japan, Australia, Singapore, and India.
- In “US & MEA” scenario, loads are simulated from 4 US locations (2 East + 2 West Coast) plus UAE, Bahrain, and South Africa.
- Our test setups cater for three of the most likely usage scenarios of a website (one page visit, forum, eCommerce checkout). For more details, please read our methodology page.
Examples of Our Tests – Screenshots


Verdict on ScalaHosting Performance
Cloud Hosting Evaluation: Passed
Many of us focus on the romanticized “ideal page load speed” touted by Google and many SEOs.
However, load speeds will vary depending on each site’s purpose and configuration. It is highly unlikely that a visitor will require your website to process a single request and then leave.
Based on this, all timings for ScalaHosting under the various scenarios fall within an acceptable range.
The essential takeaway is that aside from response speed, high volumes of simulated activity on ScalaHosting servers were all adequately served with no errors. That should be a key objective, aside from consistently decent performance.
For a better overall view, we recommend reading our full ScalaHosting Review.