
Choosing a web host often starts with one question: how fast is it? Speed determines whether visitors stay on your site, complete a purchase, or bounce away.
At HostScore, we don’t rely on vendor claims. We measure server response, track uptime for months, and run load tests that simulate real traffic. Our goal is straightforward. We want to show you performance results that reflect what you would actually experience with a host.
Our testing protocol combines industry-standard tools, structured benchmarks, and repeatable setups. By sharing this process openly, we want you to see that HostScore ratings are grounded in data, not guesswork.
To begin, let’s define what we mean by hosting speed.
What Do We Mean by “Hosting Speed”?
Hosting speed refers to how quickly a server responds to requests. It is determined by the web host’s infrastructure: server hardware, data center location, network routing, and server configuration. Hosting speed shows up in metrics like time to first byte (TTFB) and latency across regions.
Hosting speed is not the same as site speed. Site speed measures how fast a web page loads in a browser. It depends on how the site is built. A heavy theme, unoptimized images, or poor coding can slow down a site even on a powerful host. On the other hand, a well-optimized site can load quickly even if the hosting environment is only average.
This is why HostScore focuses on hosting speed. By isolating server-side factors, such as response time, uptime, load handling, and database performance, we can fairly compare hosts without the noise of design choices or plugin bloat. Hosting speed is the part of performance you can only get by choosing the right provider.

Which Tools Do We Use to Test Hosting Speed and Performance?
No single tool can explain how a host performs. A speed test might show a fast page load today, but it tells you nothing about uptime over a month or how the server holds up under traffic spikes. That’s why HostScore uses a combination of monitoring tools, benchmarking plugins, and load testing platforms.
We divide tools into four categories:
- Uptime monitoring – to track reliability.
- Speed testing – to measure how quickly servers respond and render pages.
- Load simulation – to see how servers behave when many users visit at once.
- WordPress benchmarking – to check raw CPU, database, and file performance.
Each tool covers a gap left by the others. For example, WebPageTest shows time-to-first-byte (TTFB) from multiple regions, while Bitcatcha reveals global latency differences. k6 simulates thousands of concurrent users, while UptimeRobot quietly records downtime every minute. Together, these results give us a more realistic picture of how a host performs day to day.
| Tool / Platform | What It Measures | How We Use It |
|---|---|---|
| UptimeRobot | Tracks uptime and downtime with one-minute checks | We run monitors for 30 days to measure stability |
| WebPageTest | TTFB, DNS/TLS negotiation, rendering times | Run from several regions to capture location impact |
| Google PageSpeed Insights (PSI) | Time to First Byte (TTFB) from both lab tests and real-user Chrome data | We reference PSI only for live sites with enough traffic, since Google’s dataset reflects actual user conditions rather than synthetic tests |
| Bitcatcha | Global latency (ping response) | Quick latency tests from the United States (East and West coast), United Kingdom, Singapore, Brazil, India, Australia, Japan, Canada and Germany. |
| k6 | Virtual user load, error rate | Ramp up to thousands of concurrent requests |
| Loader.io | API and endpoint stress testing | Send thousands of requests per second to test backend throughput |
| LoadView | Browser-based load simulation | Real browser traffic to test user-facing performance |
| WordPress Hosting Benchmark Tool | CPU, MySQL queries, file I/O | Test raw server capability; single-threaded baseline |
How Do We Run Our Hosting Tests?
Our hosting speed tests follow two main setups. In some cases, we use a clean WordPress install with no CDN and minimal caching to isolate a host’s raw server performance. More commonly, we configure a WooCommerce store using the official Storefront theme, essential plugins, and dummy product data. This method produces test results that are closer to what real users would experience.
For uptime, we rely on UptimeRobot’s free plan, running HTTP checks at five-minute intervals. We have been tracking hosts for years, publishing uptime status pages publicly and including individual host records in reviews whenever possible. Long-term uptime tracking gives us stability data that one-off reviews cannot match.

To measure server speed and global latency, we use WebPageTest, GTMetrix, PageSpeed Insights, and Bitcatcha. These tools show metrics such as time-to-first-byte (TTFB), Core Web Vitals (LCP, INP), and latency from different regions. This allows us to evaluate both raw server response and user experience across geographies.

For load testing, we turn to Loader.io and sometimes LoadView. Loader.io helps us simulate hundreds or thousands of concurrent requests, showing how well a server handles sudden traffic spikes. LoadView adds browser-based testing (see screenshot below), which reveals how a site behaves for actual users under stress.

We also use the WP Benchmark Tool to check CPU, MySQL queries, and file I/O performance. However, this plugin has a known limitation: it runs single-threaded. Multi-core servers, like those at 20i Autoscale, may not be fairly represented, so results should be read as a baseline rather than an absolute.
By combining WooCommerce test stores, long-term uptime monitoring, global speed checks, and structured load testing, HostScore balances controlled benchmarks with real-world hosting conditions.
Which Hosting Performance Metrics Do We Track?
HostScore tracks multiple web hosting performance metrics because speed alone does not tell the full story. A host may deliver fast first-page loads but fail when traffic scales or when visitors connect from different regions. By using several benchmarks together, we capture a balanced view of everyday speed, uptime reliability, and resilience under pressure.
Server Response Time (TTFB)
Time to First Byte (TTFB) measures how quickly a server responds when a visitor makes a request. It is the foundation of hosting speed.
A low TTFB (under 500ms) shows that the server can process requests efficiently. A high TTFB often signals overloaded servers, slow database queries, or underpowered infrastructure.
Global Latency
Latency measures how long it takes for data to travel between the server and visitors. We use Bitcatcha and WebPageTest regional runs to see how hosts perform worldwide.
A host with servers close to its audience usually shows lower latency. For example, a site hosted in Singapore delivers faster response to Southeast Asia than to North America. Latency matters most for global businesses or eCommerce stores with international buyers.
Uptime Percentage
Uptime measures reliability over time. HostScore uses UptimeRobot with five-minute HTTP checks to monitor whether a server stays online. We track uptime continuously and publish status reports publicly.
A strong hosting provider should reach at least 99.95% uptime, which equals less than 22 minutes of downtime per month. Anything lower risks lost sales, reduced SEO rankings, and poor customer trust.
Load Handling Capacity
Speed tests show how a site performs for a single visitor. Load tests reveal how a server behaves when traffic surges.
We use Loader.io to send hundreds or thousands of concurrent requests to our WooCommerce test stores. The key metrics include P95 response time, error rate, and thoughput stability.
We also use LoadView for browser-based load tests. This shows how real users would experience pages when multiple transactions run at once.
CPU, Database, and File I/O
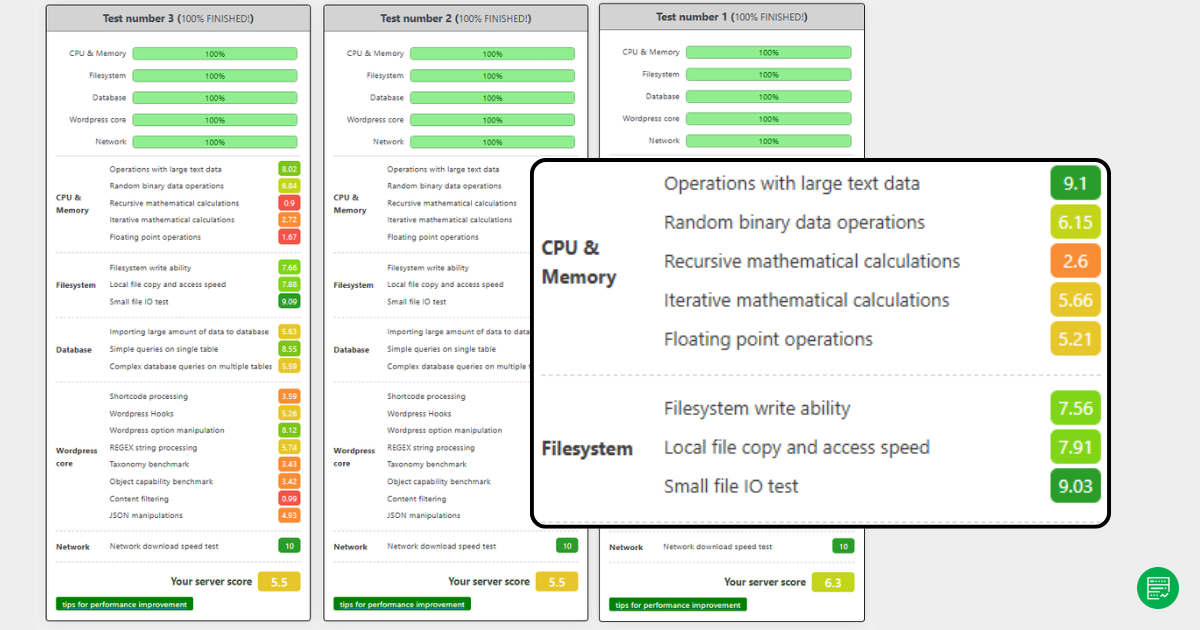
The WordPress Hosting Benchmark Tool checks how servers handle core processing tasks.
- CPU test measures how quickly the server executes PHP requests.
- Database test measures how fast MySQL queries complete.
- File I/O test measures read/write speeds for storage.
These results provide a baseline for comparing hosts. However, since the plugin runs single-threaded, it may not represent multi-core systems fairly — something we observed in providers like 20i.
Why Multiple Metrics Matter?
Looking at only one number never tells the whole story of a host. A server may deliver a fast TTFB in WebPageTest, yet stumble the moment 200 visitors arrive at once.
Another host may handle load gracefully but suffer from high latency for overseas customers. Even uptime figures, while critical, don’t explain how a site feels to the end user when the server is online.
That’s why HostScore blends these measurements.
Speed tests capture the raw efficiency of a server, uptime monitoring shows long-term reliability, latency testing reveals the impact of geography, load tests highlight scalability, and benchmarks uncover underlying CPU and storage strength. When combined, these metrics paint a complete picture of how hosting performs in real-world scenarios.
How Do We Compare Different Hosting Plans?
Not all hosting plans are built the same. A shared plan with limited CPU and memory should not be judged by the same yardstick as a managed WordPress or dedicated server. To make comparisons fair, we evaluate each web host within its plan category.
Tier-Based Comparisons


We segment results into tiers: Shared Hosting, VPS / Cloud, Managed WordPress, and Dedicated Servers. This ensures a $3 per month shared plan is measured against other entry-level hosts; while a $250 dedicated server is compared against enterprise-grade peers. You can then see which hosts perform best in their respective class.
Realistic Testing Environments
When we test hosting plans, we set them up in ways that reflect how people actually use them. Shared plans are usually deployed with a straightforward WordPress site and a few essential plugins, much like the setup a small business would run for its company website or blog. VPS and dedicated servers, on the other hand, are provisioned with heavier builds — for example, a WooCommerce store populated with multiple product pages and plugins — to simulate the demands of eCommerce or membership platforms. Managed WordPress hosting is reviewed with attention to its built-in advantages, such as caching layers, staging environments, and automated updates.
By aligning each plan with its likely use case, we avoid results that are skewed by unrealistic configurations and give readers benchmarks that feel closer to real-world conditions.
Price-to-Performance Balance
Performance alone doesn’t tell you if a plan is worth it. We always check whether the speed, uptime, and scalability justify the price. A blazing-fast host that costs double the competition may not be the right choice for a new blogger. Conversely, slightly higher pricing can be justified if uptime or load handling is significantly better.
Contextual Fit
When comparing hosts, our goal is not to crown a single “best web hosting” provider but to identify which service best fits a particular use case. A shared plan may serve a small business flyer site perfectly well, yet struggle to handle the demands of a busy PrestaShop or WooCommerce store. Conversely, a managed VPS plan that looks expensive on paper may be the right choice for developers who need scalability, root access, and system administration support.
By layering category, setup, price, and use case, we provide comparisons that make sense for real buyers, not just raw benchmark enthusiasts.
Can You Test Your Hosting Speed Yourself?
Yes, and you should. Every web host markets itself as “fast,” but the only speed that matters is what your visitors experience on your site. Performance also changes over time. A server that feels quick when you sign up can slow down months later if the host oversells its resources or if your site traffic grows. Testing your own hosting gives you a baseline you can monitor and compare.
The good news is you don’t need enterprise equipment or deep technical skills to start. With free, accessible tools, anyone can measure how quickly a server responds, whether uptime claims hold true, and how the site behaves under load. A few well-chosen tests can uncover issues like high latency for overseas visitors, unreliable uptime, or servers that buckle the moment a campaign drives extra traffic.
At HostScore, we use a structured testing protocol to benchmark hosts consistently. But we also encourage site owners to run their own checks. Your website’s setup, audience location, and usage patterns are unique. Running these tests yourself helps you see whether your hosting plan truly meets your needs.
Here’s how you can get started:
- Begin with Google PageSpeed Insights (PSI). Run a test and check the TTFB value in the Chrome UX section. If your site has enough traffic, PSI will show how real users experience server response.
- Use Bitcatcha for a quick look at global latency. Ping results from Asia, North America, and Europe reveal whether your server location matches your audience.
- For uptime, create a free account with UptimeRobot. Set an HTTP monitor at five-minute intervals and let it run for 30 days. This will give you a reliability snapshot.
- Finally, try Loader.io to simulate traffic spikes. Even a free test with a few hundred concurrent requests will show whether your site stays responsive or begins to fail.
What Our Testing Does (and Doesn’t) Cover?
Our testing process is designed to highlight how a host performs in conditions close to reality. Still, like any benchmark, it has boundaries.
What we do cover are the factors most hosting buyers care about: server response time (TTFB), global latency, uptime reliability, load handling capacity, and baseline CPU, database, and file I/O performance. These results show whether a host is fast, stable, and able to handle real traffic.
What we don’t cover are design-related bottlenecks such as heavy themes, oversized images, or poorly written plugins. These affect site speed but are outside the host’s control. We also don’t test every single plan from every provider. Instead, we focus on representative plans in shared, VPS, managed WordPress, and dedicated tiers.
Some tools come with their own caveats. The WordPress Hosting Benchmark Tool, for example, runs single-threaded. That means multi-core servers, like those used by 20i Autoscale, may not be measured fairly. Google’s PSI TTFB values, meanwhile, only appear if a site has enough visitors to feed Chrome user data.
By disclosing both what we measure and what we don’t, we aim to give readers context so they can interpret results with confidence.
How Is Our Approach Different from Other Hosting Review Sites?
Many review sites run quick tests or rely on marketing material. At HostScore, we invest time in long-term monitoring and structured benchmarking so our ratings reflect reality, not just a one-off snapshot.
Some sites only test uptime for a week or two. We’ve been running uptime checks for years, publishing public dashboards so readers can verify results themselves. Others run simple page-load checks. We layer multiple tests: TTFB, latency across regions, load resilience with Loader.io, and CPU/database benchmarks.

We also test hosts in realistic setups, often with WooCommerce stores loaded with products and plugins. This approach captures how servers behave under practical conditions, rather than in empty demo sites.
Finally, we publish not just scores but also screenshots, logs, and status pages. This transparency lets readers see the raw data behind our conclusions, making our reviews more trustworthy than those that simply declare a winner without evidence.
Why It Matters to Hosting Buyers?
Hosting speed and performance are not just technical details. They determine whether customers stay on your site, complete a purchase, or click away. A fast server improves user experience and search rankings. Reliable uptime protects business revenue and reputation. Strong load handling ensures your site won’t collapse the moment traffic spikes.
At HostScore, we combine real-world tests, long-term monitoring, and transparent reporting so buyers can see beyond marketing claims. Our goal is not to crown a single “fastest host,” but to help you choose the host that best fits your needs, budget, and audience.
When you compare hosting providers, focus on more than price. Look at how they perform under load, how consistent their uptime is, and whether their servers are located close to your customers. Those factors will make a bigger difference to your business than saving a dollar or two each month.
If you’re ready to dive deeper, explore our recommendations here:
- Best Small Business Hosting
- Best VPS Hosting
- Best Managed WordPress Hosting
- Compare hosting prices with our calculator (free)
These guides use the same testing principles outlined above, giving you a clear, data-backed path to the hosting that works best for you.