

Flashcloud delivered consistent shared-hosting performance in our recent tests, with WordPress benchmark scores between 6.4 and 7.0, an A+ Bitcatcha server-speed rating, and 100% uptime during our first 30 days of monitoring.
The strongest results came from network response and filesystem operations, while raw CPU processing remained more average. Flashcloud compensates for this with a pre-configured performance stack that includes Cloudflare CDN, LiteSpeed Cache, Redis object caching, and NVMe storage.
Our test server is located in Singapore, so the extremely low regional latency should be viewed in that context. Users hosting closer to other Flashcloud server locations should expect the same principle to apply: the shorter the physical distance between server and visitor, the lower the network latency.
Note: This page focuses only on Flashcloud performance testing and what our measurements mean. For pricing, features, usability, and our overall recommendation, see our full Flashcloud review.
How Did We Test Flashcloud Hosting?
Flashcloud was tested using a real WordPress and WooCommerce website hosted on its Scale shared hosting plan.
Our test server is located in Singapore and runs on Flashcloud’s LiteSpeed-based shared hosting environment. The account uses NVMe storage and comes with Cloudflare CDN, LiteSpeed Cache, and Redis object caching already integrated into the hosting stack.
We used three different tests because each measures a different part of hosting performance:
- WordPress Hosting Benchmark measures backend processing such as CPU operations, database work, filesystem activity, and WordPress core functions.
- Bitcatcha measures server response latency from different geographic locations.
- Uptime monitoring (ongoing) checks whether the site remains reachable over time.
Our test results should not be treated as interchangeable. A fast network response does not necessarily mean fast PHP execution, while a strong backend benchmark does not guarantee low latency for visitors located far from the server.
How Did Flashcloud Perform in the WordPress Benchmark?
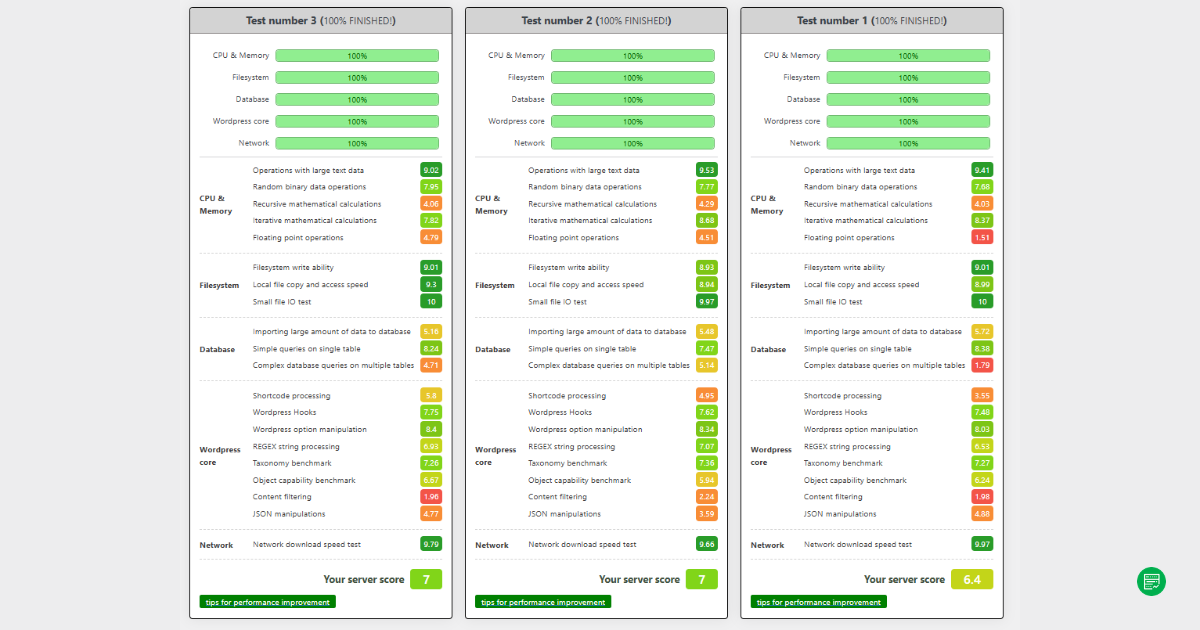
Flashcloud scored between 6.4 and 7.0 across our latest WordPress Hosting Benchmark runs, which places its backend performance at a usable and consistent level for shared hosting.
The results were reasonably stable between runs rather than swinging dramatically from one test to another. That matters because consistency is often more useful to a normal WordPress site than a single unusually high benchmark result.
Strengths
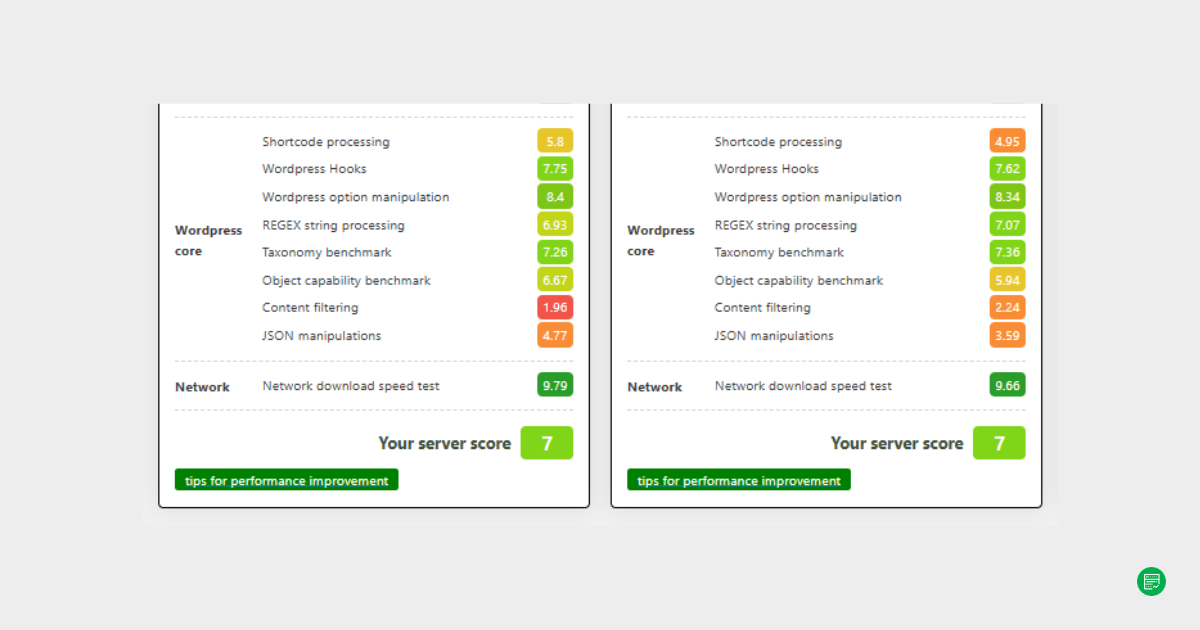
Flashcloud handles core WordPress operations reliably. Tasks such as WordPress hooks, option handling, and basic database interactions performed consistently across all runs.
Network-related scores were also stable, indicating no obvious bottlenecks in request handling. Filesystem performance improved significantly in our latest tests, aligning with expected results for NVMe-based storage.
Limitations
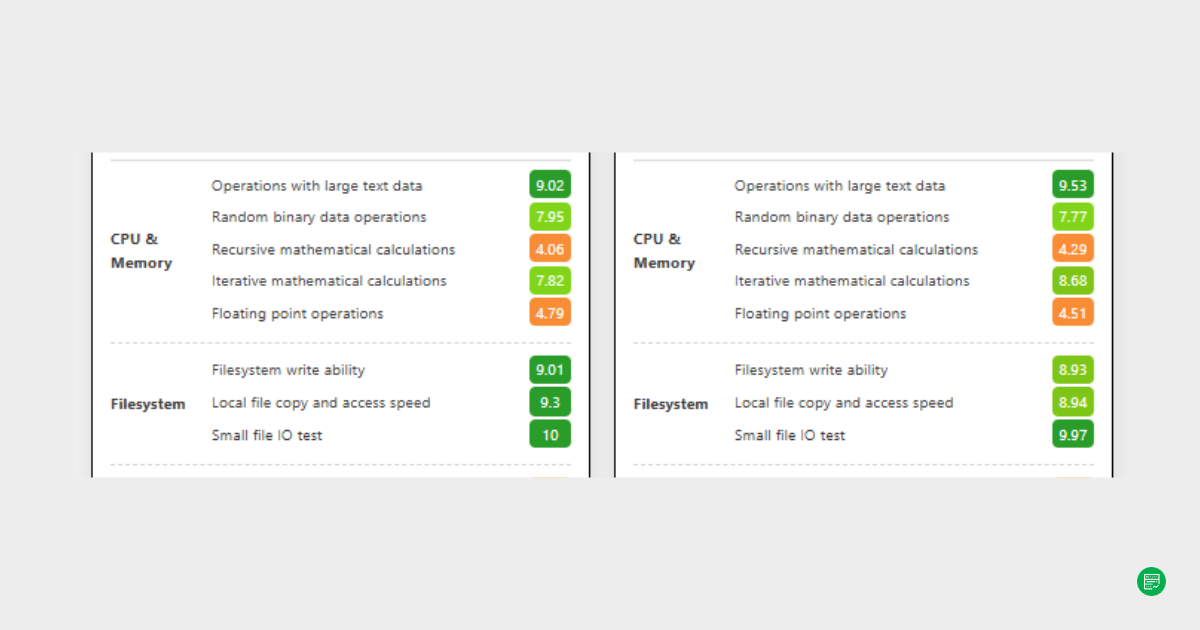
Some CPU-related tasks scored lower, particularly in more complex operations such as content filtering and mathematical processing. This is typical of shared hosting environments where CPU resources are distributed across multiple users.
HostScore’s Interpretation
Flashcloud delivers consistent backend performance for normal WordPress workloads, with particularly strong filesystem results after the revised LVE allocations.
Raw CPU processing remains the weaker part of the shared hosting environment, but Flashcloud reduces its real-world impact through multiple caching layers. For small business websites and moderate WordPress or WooCommerce workloads, the overall backend experience is practical rather than performance-leading.
How Fast Is Flashcloud’s Server Response?
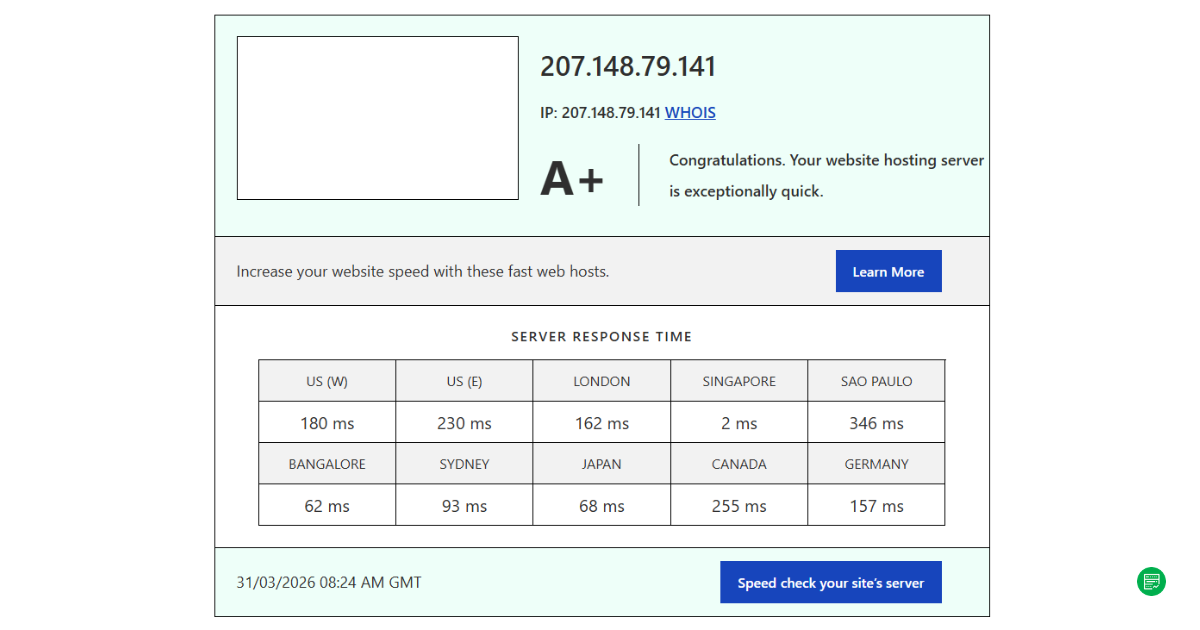
Flashcloud received an A+ rating in our Bitcatcha test, with exceptionally low latency from locations close to our Singapore server.
Bitcatcha measures how quickly the server responds from different parts of the world. It does not measure how long WordPress takes to generate a complete page, so these results should primarily be read as a network-latency test.
What Were Flashcloud’s Bitcatcha Results?
The strongest result came from Singapore at roughly 2 ms, which is expected because our Flashcloud server is also located in Singapore.
Response times increased progressively from locations farther away, including Europe and North America. This is normal network behavior: physical distance and routing add latency even when the server itself is performing correctly.
The important result is not that Flashcloud delivers 2 ms response times everywhere. It is that the Singapore server responds very quickly to nearby users and maintains reasonable response times across more distant locations.
How Much Does Server Location Affect Flashcloud Speed?
Server location has a direct impact on Flashcloud latency.
Flashcloud offers five server locations, allowing customers to deploy closer to the audience they expect to serve. Our Southeast Asian results are therefore specific to the Singapore deployment rather than a universal Flashcloud speed figure.
A website primarily serving European users should select a European location where available, while a North American audience should normally be hosted closer to North America.
HostScore’s Interpretation
Flashcloud performs best when the selected server location matches the target audience.
Our Singapore deployment delivered extremely low latency across Southeast Asia because the physical distance was small. The wider global results reinforce a basic hosting principle: choose the server region closest to the majority of your visitors rather than comparing one headline latency figure.
How Reliable Was Flashcloud During Our Uptime Test?
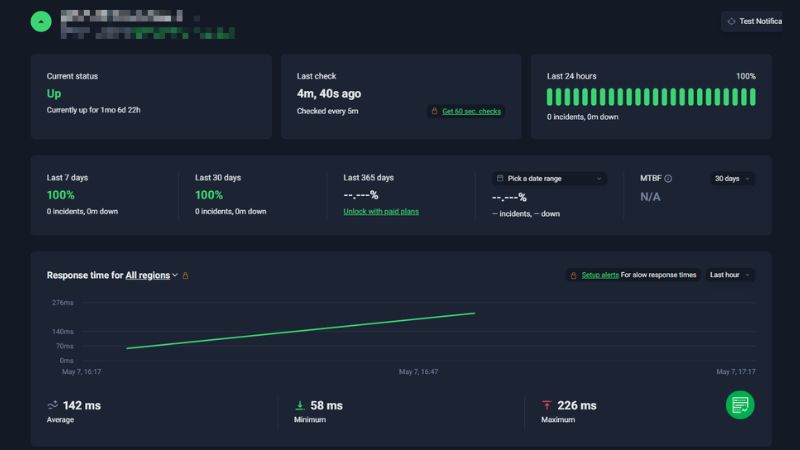
Flashcloud maintained 100% uptime throughout our first 30 days of monitoring, with no recorded outages during the test period. We checked the website every five minutes using Uptime Robot. Across that month, our monitor recorded no downtime incidents and no periods where the site became unavailable. The monitoring system recorded an average response time of approximately 142 ms, with results ranging from around 58 ms to 226 ms during the period.
HostScore’s Interpretation
Flashcloud’s first month of uptime monitoring is encouraging. A full month without recorded downtime indicates stable short-term service delivery, while the response-time range remained reasonably consistent throughout the monitoring period.
Thirty days is still too short to make a strong claim about long-term reliability. We will continue monitoring the account and update the results as a larger uptime history becomes available.
How Does Flashcloud’s Caching Stack Affect Real-World Performance?
Flashcloud uses several pre-configured caching layers to reduce the amount of work performed by the origin server for each visitor request.
Cloudflare CDN sits at the network edge and can serve cached content closer to visitors. Flashcloud’s updated client dashboard (see screenshots below) now gives users direct control over this layer, including the ability to manage proxy status, enable development mode, and purge the Cloudflare cache.
- LiteSpeed Cache handles WordPress and server-level caching, reducing the need to generate the same page repeatedly.
- Redis object caching stores frequently requested WordPress database objects in memory, reducing repeated database processing.
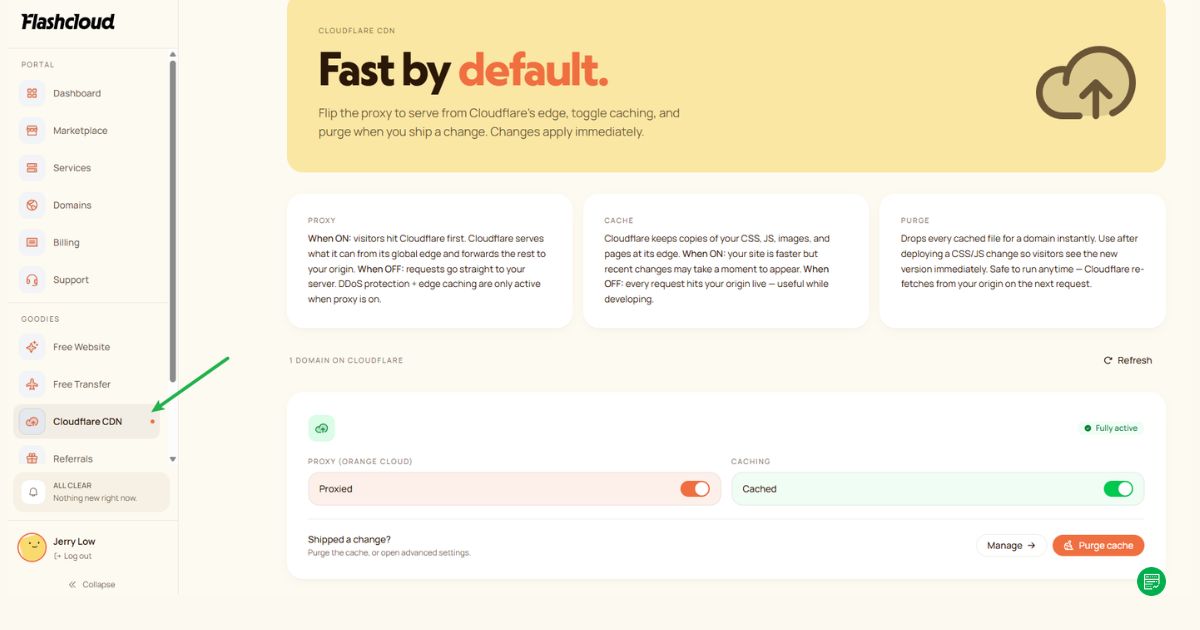
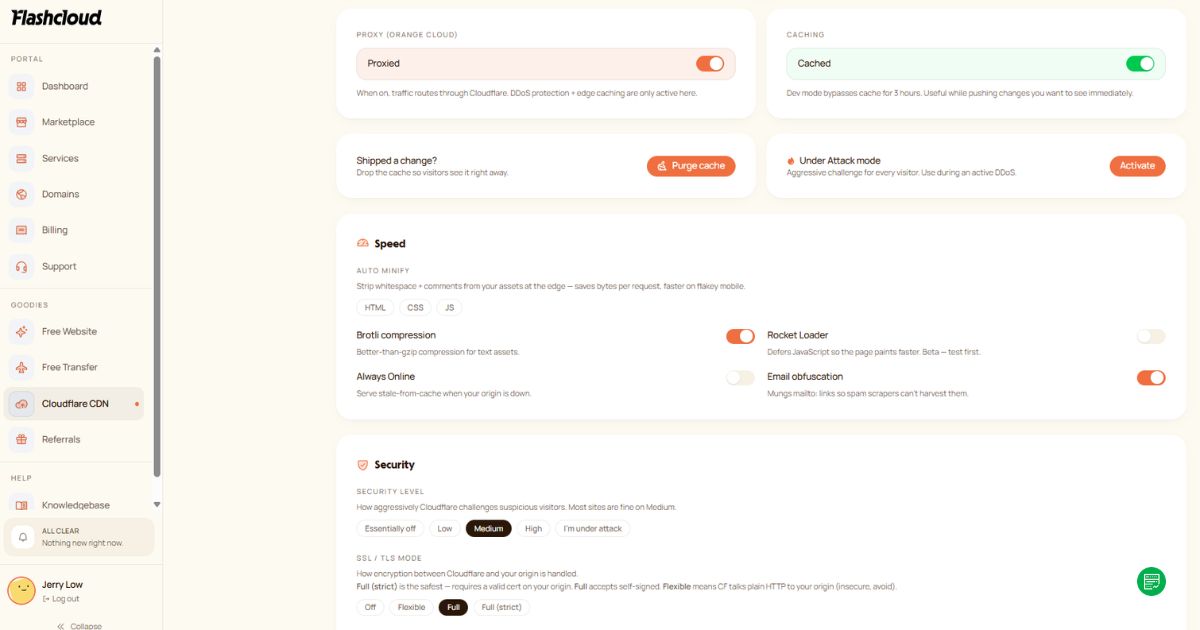
Together, these layers help explain why raw CPU benchmarks do not tell the whole story. An uncached WordPress request may require PHP execution, database queries, and page generation, while a cached request can bypass much of that work.
This architecture suits Flashcloud’s broader approach: pre-configure common performance optimizations so users do not need to build the caching stack themselves.
What Did We Learn From Testing Flashcloud?
Flashcloud produced a balanced set of results across our three performance tests.
WordPress backend scores remained consistent at 6.4 to 7.0, with strong filesystem performance following the updated CloudLinux LVE limits. CPU processing was less impressive, but Cloudflare, LiteSpeed Cache, and Redis reduce the amount of repeated backend work during normal site usage.
Network performance was particularly strong from our Singapore server, earning an A+ Bitcatcha rating and around 2 ms latency from Singapore. Our first month of uptime monitoring also recorded 100% availability.
The main takeaway is that Flashcloud’s performance comes from a combination of adequate shared-hosting resources and a well-integrated caching stack rather than exceptional raw CPU power alone.
For our assessment of Flashcloud’s pricing, bundled features, usability, and overall value, continue to our full Flashcloud hosting review.

